Surveys are powerful tools for collecting data and gaining insights into various aspects of society, business, and research. However, navigating the statistical landscape of survey results can be daunting. This article serves as a comprehensive guide to understanding survey statistics, empowering readers to interpret data accurately and make informed decisions based on survey findings.
- Sampling Techniques: Understanding how survey samples are selected is crucial. Whether using random sampling, stratified sampling, or convenience sampling, each method has implications for the generalizability of results.
- Response Rate Significance: The response rate, the proportion of completed surveys to the total number distributed, impacts the reliability of the data. A low response rate may introduce bias, affecting the survey’s representativeness.
Understanding Descriptive Statistics:
- Mean, Median, Mode: Descriptive statistics, such as mean (average), median (middle value), and mode (most frequent value), provide a snapshot of the central tendencies in survey data, offering insights into the typical respondent’s perspective.
- Standard Deviation: Standard deviation measures the amount of variation or dispersion in a set of survey responses. A higher standard deviation indicates greater diversity in opinions or behaviors among respondents.
Grasping Inferential Statistics:
- Margin of Error: The margin of error is a critical component of survey statistics. It reflects the range within which the true population parameter is likely to fall. A lower margin of error indicates greater precision.
- Confidence Intervals: Confidence intervals provide a range of values within which the true population parameter is likely to lie. Commonly set at 95%, a wider confidence interval implies greater uncertainty.
The Impact of Survey Design:
- Question Wording and Order Effects: The way questions are phrased and the order in which they are presented can influence responses. Careful consideration of question design helps minimize bias and ensure accurate results.
- Avoiding Nonresponse Bias: Nonresponse bias occurs when certain groups are more or less likely to participate in a survey, skewing the results. Strategies to minimize nonresponse bias include follow-up surveys and incentives.
Interpreting Likert Scales and Response Categories:
- Likert Scale Analysis: Likert scales, commonly used in surveys, measure respondents’ agreement or disagreement with a series of statements. Analyzing Likert scale data involves considering both the average response and the distribution of responses.
- Handling Open-Ended Responses: Open-ended questions provide valuable qualitative data but require a different approach to analysis. Categorizing responses and identifying common themes contribute to a meaningful interpretation.
Recognizing Sampling Errors:
- Random Sampling Errors: Even with rigorous sampling techniques, random sampling errors may occur. These errors are inherent in statistical processes and are crucial to acknowledge when interpreting survey results.
- Systematic Sampling Errors: Systematic errors arise from flaws in the survey design or implementation. Identifying and addressing systematic errors is vital for ensuring the reliability and validity of survey findings.
Ethical Considerations in Survey Research:
- Ensuring Informed Consent: Respecting respondents’ autonomy is essential. Providing clear information about the survey’s purpose, how data will be used, and obtaining informed consent safeguards ethical standards.
- Protecting Participant Confidentiality: Upholding confidentiality is a cornerstone of ethical survey research. Measures such as anonymizing data and ensuring secure storage contribute to maintaining trust with respondents.
Practical Tips for Survey Analysis:
- Data Cleaning and Validation: Before analysis, thorough data cleaning and validation help identify and rectify errors. This ensures the integrity of the dataset and enhances the reliability of the survey results.
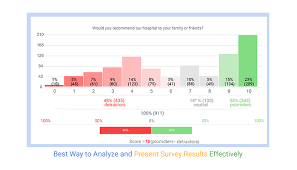
- Visualizing Data: Utilizing data visualization tools, such as charts and graphs, aids in conveying survey findings effectively. Visual representations enhance understanding and facilitate clearer communication of results.Summarize the importance of understanding survey statistics for making informed decisions. Encourage readers to approach survey results critically, considering the nuances of methodology, statistical analysis, and ethical considerations.

